When store owners or purchasing managers think about inventory, the first thing that usually comes to mind is the total value of their merchandise.
If the inventory value drops too much, it’s a sign that products are missing from the shelves.
If it rises too high, it means there’s too much money tied up in products that might take a long time to sell.
This metric — the total inventory value — is useful, but it hides an important detail:
the variety of products available.
The problem with looking only at total value
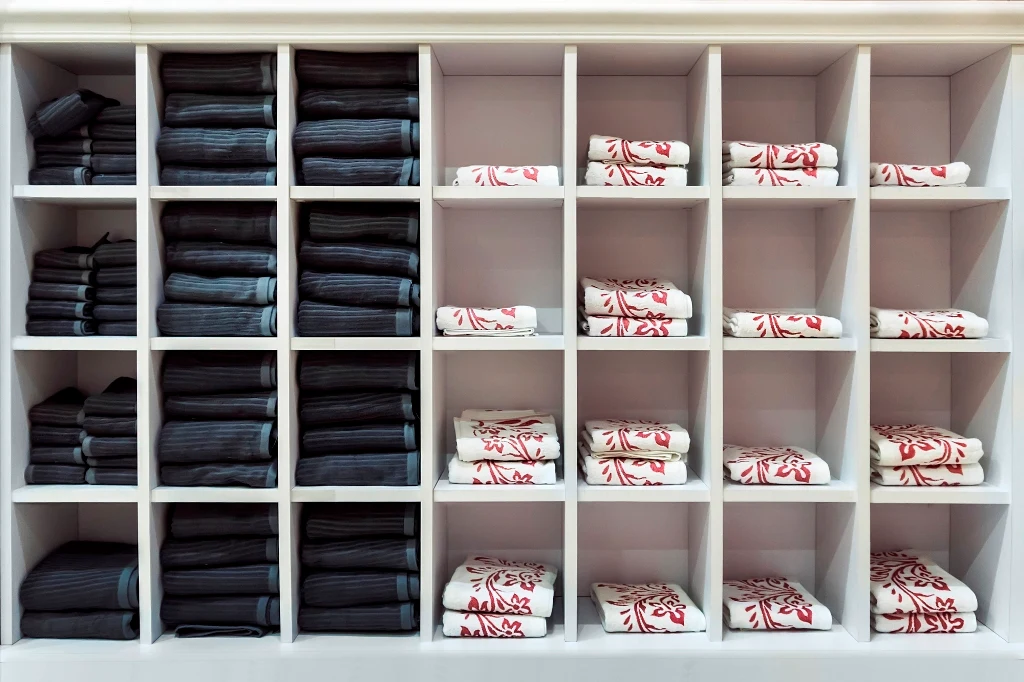
Imagine a clothing store with R$ 500,000 in inventory.
At first glance, that sounds like a healthy number, right?
But now imagine that half of that value (R$ 250,000) is concentrated in just one model of jeans.
(Okay, the example is exaggerated — but it helps make the real problem clear.)
That means the store has little product diversity — and therefore, few options for the customer.
In the fashion world, especially for the female audience, variety is essential: customers want to mix and match, explore styles, and find something new.
An inventory concentrated in a few products can lead to two major risks:
- Falling sales, due to a lack of attractive options;
- Higher financial risk, if those concentrated items don’t sell.
How to measure variety?
Today, many retailers try to assess variety by checking stock reports — or by “feeling” the store, literally walking through the aisles and observing.
But that’s subjective and time-consuming.
Ideally, you’d have a quick and objective metric to show how diverse your store’s inventory really is.
That’s where a powerful concept from mathematics and physics comes in: entropy.
What is entropy (in simple terms)
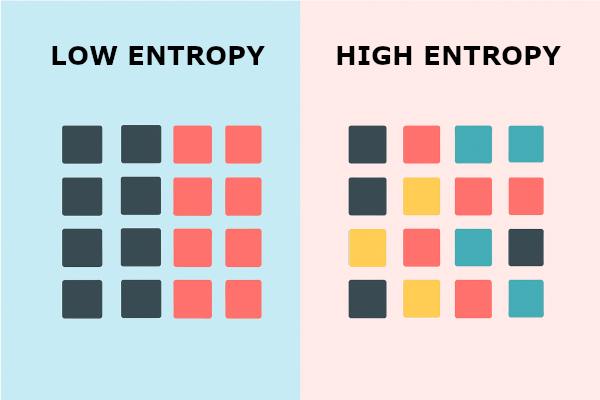
Simply put, entropy measures the diversity of a distribution.
The more evenly distributed the items are, the higher the entropy.
The more concentrated — meaning a few products represent most of the inventory — the lower the entropy.
In other words:
- A store with many different products and balanced quantities → High entropy (high variety)
- A store with few products dominating the inventory → Low entropy (low variety)
How to calculate inventory entropy
The idea is simple:
Take all your products (SKUs) and calculate their proportion of the total inventory value.
Then apply the entropy formula:
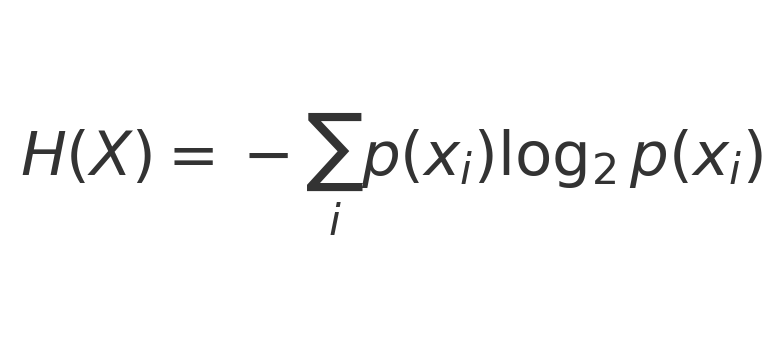
The result is a number — and the higher it is, the more diverse your inventory.
- If all products have similar proportions → high entropy.
- If one product dominates the inventory → low entropy.
Real-world case: the impact of variety on sales
We applied the inventory entropy metric to one of our retail clients — a popular apparel store — tracking its performance over the course of a year.
The goal was to understand whether product variety (entropy) was related to monthly sales performance.
Between August 2024 and September 2025, there were no major market changes — no new competitors, no supplier shifts, no external economic shocks.
That means the environment was stable enough to isolate the effect of product variety on sales.
The table below shows the monthly sales value (R$) and the average inventory entropy for each month:
| Month | Avg. Entropy | Monthly Sales (R$) |
| 08/2024 | 7.98 | R$168,200.00 |
| 09/2024 | 8.33 | R$157,781.00 |
| 10/2024 | 8.04 | R$168,288.00 |
| 11/2024 | 8.11 | R$164,388.00 |
| 12/2024 | 8.04 | R$362,986.00 |
| 01/2025 | 7.47 | R$137,069.00 |
| 02/2025 | 7.44 | R$107,844.00 |
| 03/2025 | .38 | R$123,521.00 |
| 04/2025 | 7.61 | R$134,253.00 |
| 05/2025 | 7.8 | R$151,756.00 |
| 06/2025 | 7.77 | R$164,043.00 |
| 07/2025 | 7.85 | R$313,334.00 |
| 08/2025 | 7.82 | R$150,235.00 |
| 09/2025 | 7.63 | R$102,073.00 |
Two months clearly stand out as outliers — December and July — which are strong seasonal periods for this store (holidays, vacations, sales events, etc.).
Following good data analysis practices, we excluded these outliers to avoid distorting the interpretation.
When plotting entropy vs. monthly sales, the trend becomes clear: as entropy increases, sales also tend to rise.
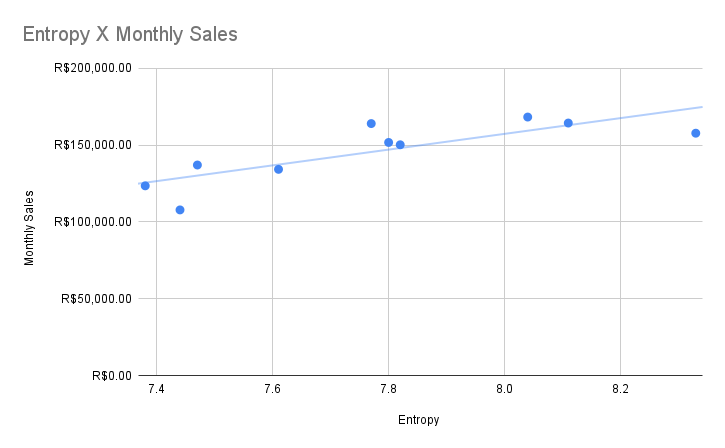
The Pearson correlation coefficient between entropy and sales was 0.75, indicating a strong positive correlation.
Pearson’s correlation ranges from -1 to +1: values near 0 mean no correlation, and values near +1 indicate a strong positive relationship..
In other words: the greater the variety of products, the higher the sales volume.
Interpretation and conclusions
Of course, store sales are influenced by many factors — marketing, competition, product quality, pricing, and the broader economy.
But in a stable environment, the role of variety becomes clear:
stores with greater product diversity sell more.
The inventory entropy metric allows you to track that variety objectively and efficiently.
With this indicator, managers can identify when their mix is becoming too concentrated — and act before it starts to hurt sales.
💡 In summary
Tracking only total inventory value is like looking at your bank balance without knowing where the money comes from.
Entropy adds a new layer of intelligence to your management: it shows whether your inventory is balanced and diverse enough to attract customers.
More variety means more opportunities to sell — and now there’s a metric to prove it.
🚀 How DIENEKES can help
This is a real case developed by the Dienekes team.
We applied the inventory entropy metric to help our client understand the direct impact of product variety on sales, enabling smarter decisions around purchasing, restocking, and pricing.
Dienekes specializes in data analytics and retail intelligence, turning information into actionable insights that boost store performance.
If you want to:
✅ Identify which products truly drive your revenue
✅ Monitor product variety objectively
✅ Stay ahead of the competition with data-driven decisions
👉 Talk to Dienekes.
We’ll help you turn your data into real business results.